kafka-ui
Versatile, fast and lightweight web UI for managing Apache Kafka® clusters. Built by developers, for developers.
DOCS •
QUICK START •
COMMUNITY DISCORD
AWS Marketplace •
ProductHunt
UI for Apache Kafka is a free, open-source web UI to monitor and manage Apache Kafka clusters.
UI for Apache Kafka is a simple tool that makes your data flows observable, helps find and troubleshoot issues faster and deliver optimal performance. Its lightweight dashboard makes it easy to track key metrics of your Kafka clusters - Brokers, Topics, Partitions, Production, and Consumption.
DISCLAIMER
UI for Apache Kafka is a free tool built and supported by the open-source community. Curated by Provectus, it will remain free and open-source, without any paid features or subscription plans to be added in the future. Looking for the help of Kafka experts? Provectus can help you design, build, deploy, and manage Apache Kafka clusters and streaming applications. Discover Professional Services for Apache Kafka, to unlock the full potential of Kafka in your enterprise!
Set up UI for Apache Kafka with just a couple of easy commands to visualize your Kafka data in a comprehensible way. You can run the tool locally or in the cloud.
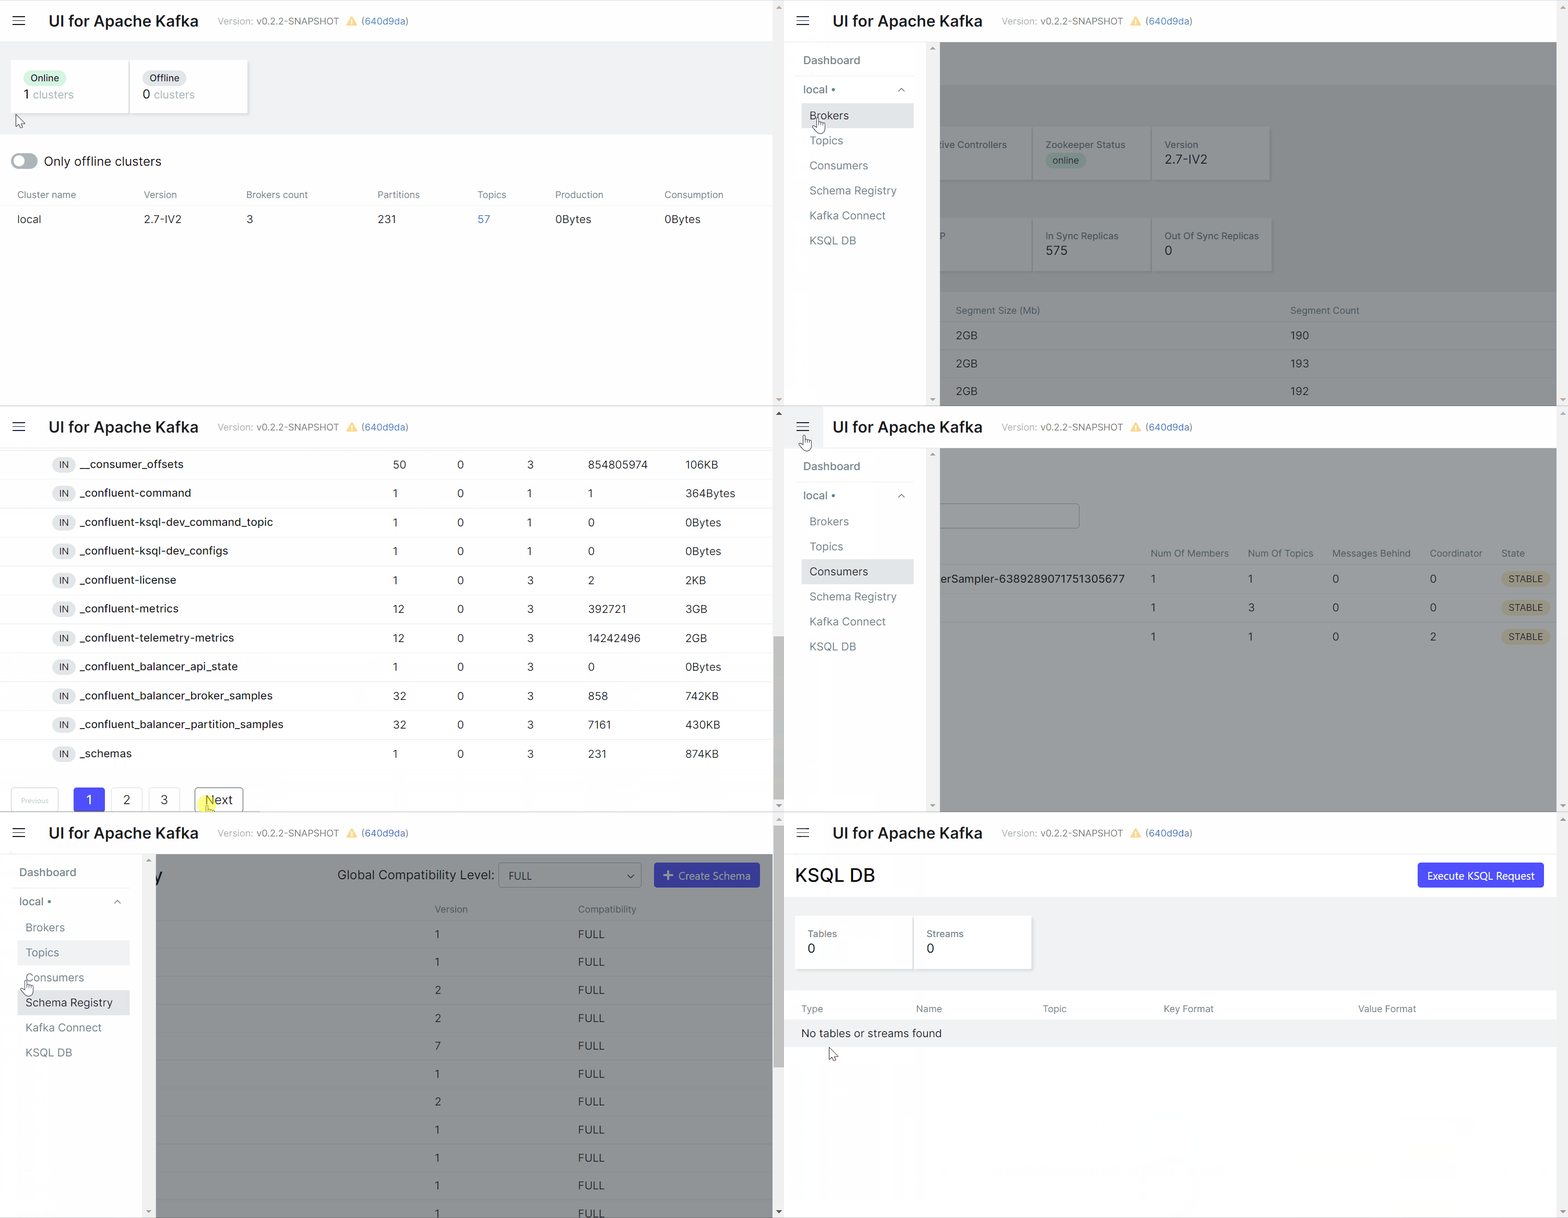
Features
- Multi-Cluster Management — monitor and manage all your clusters in one place
- Performance Monitoring with Metrics Dashboard — track key Kafka metrics with a lightweight dashboard
- View Kafka Brokers — view topic and partition assignments, controller status
- View Kafka Topics — view partition count, replication status, and custom configuration
- View Consumer Groups — view per-partition parked offsets, combined and per-partition lag
- Browse Messages — browse messages with JSON, plain text, and Avro encoding
- Dynamic Topic Configuration — create and configure new topics with dynamic configuration
- Configurable Authentification — secure your installation with optional Github/Gitlab/Google OAuth 2.0
- Custom serialization/deserialization plugins - use a ready-to-go serde for your data like AWS Glue or Smile, or code your own!
- Role based access control - manage permissions to access the UI with granular precision
- Data masking - obfuscate sensitive data in topic messages
The Interface
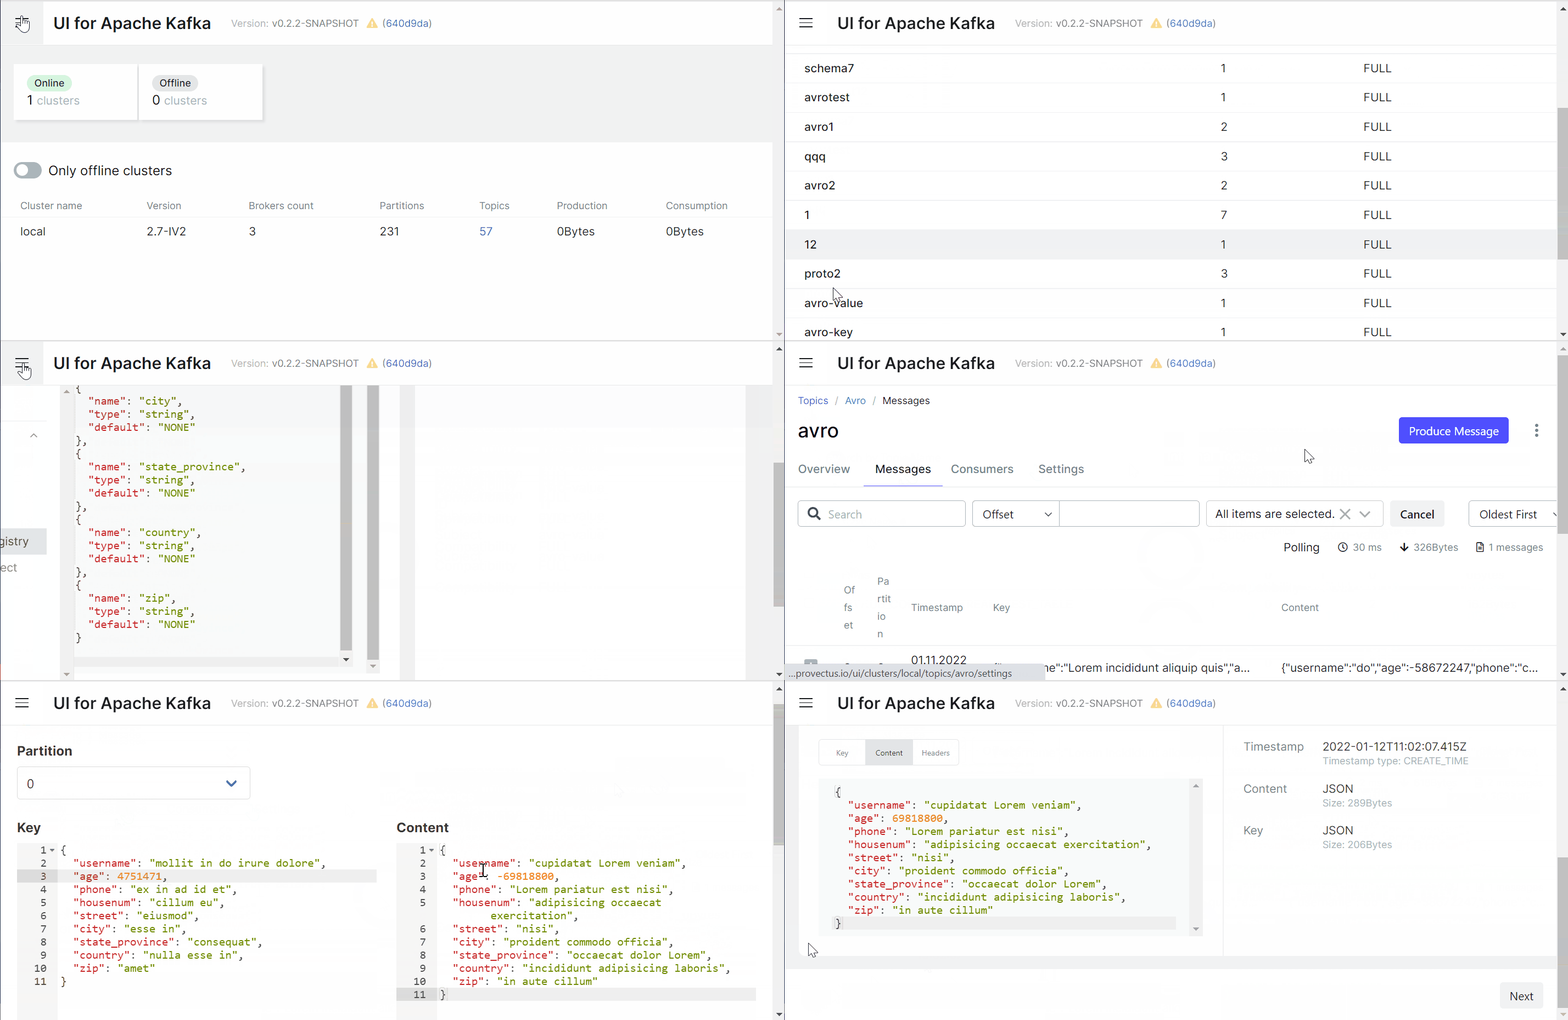
UI for Apache Kafka wraps major functions of Apache Kafka with an intuitive user interface.

Topics
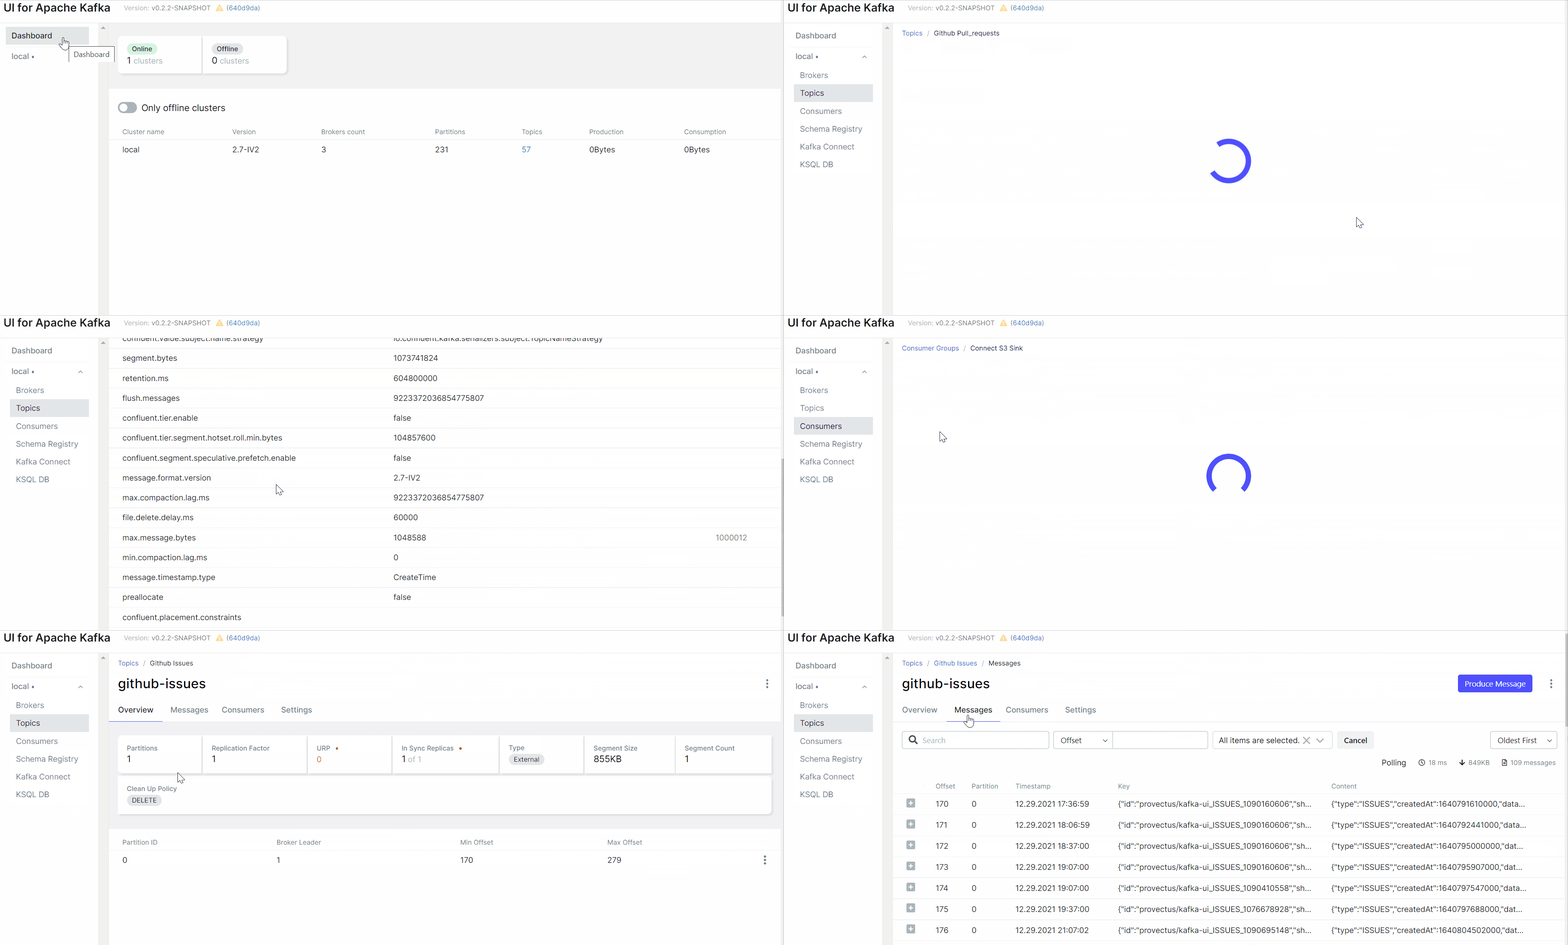
UI for Apache Kafka makes it easy for you to create topics in your browser by several clicks, pasting your own parameters, and viewing topics in the list.

It's possible to jump from connectors view to corresponding topics and from a topic to consumers (back and forth) for more convenient navigation. connectors, overview topic settings.
Messages
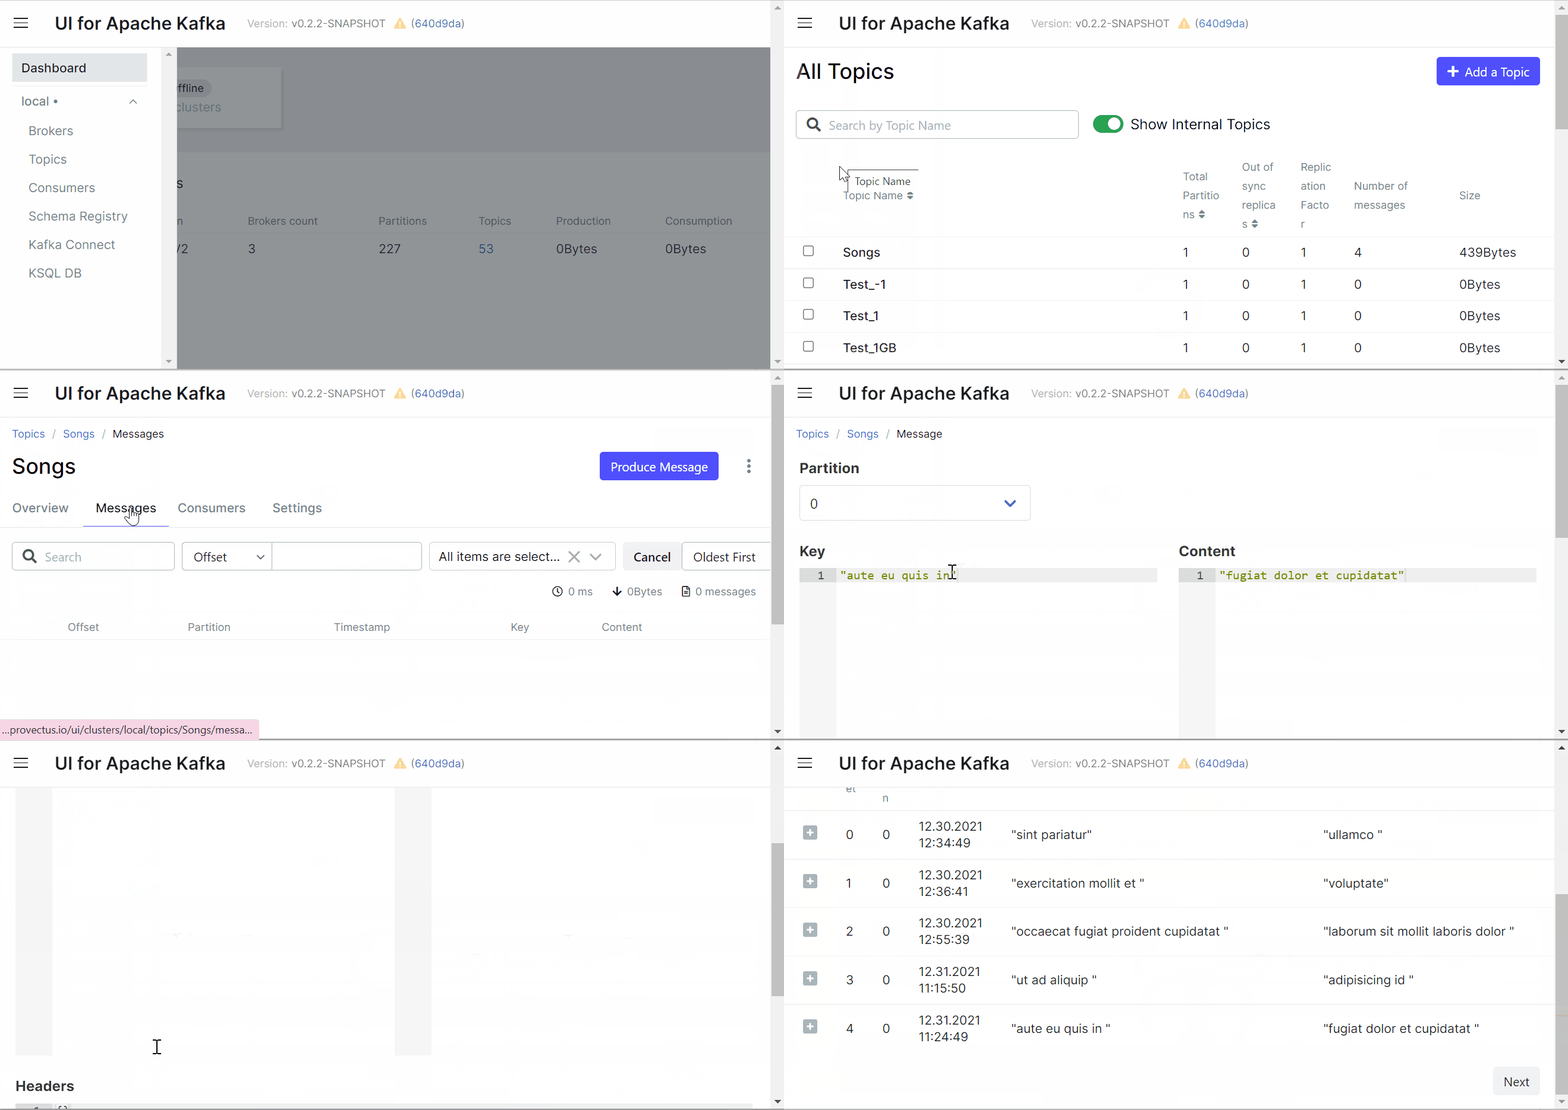
Let's say we want to produce messages for our topic. With the UI for Apache Kafka we can send or write data/messages to the Kafka topics without effort by specifying parameters, and viewing messages in the list.
Schema registry
There are 3 supported types of schemas: Avro®, JSON Schema, and Protobuf schemas.
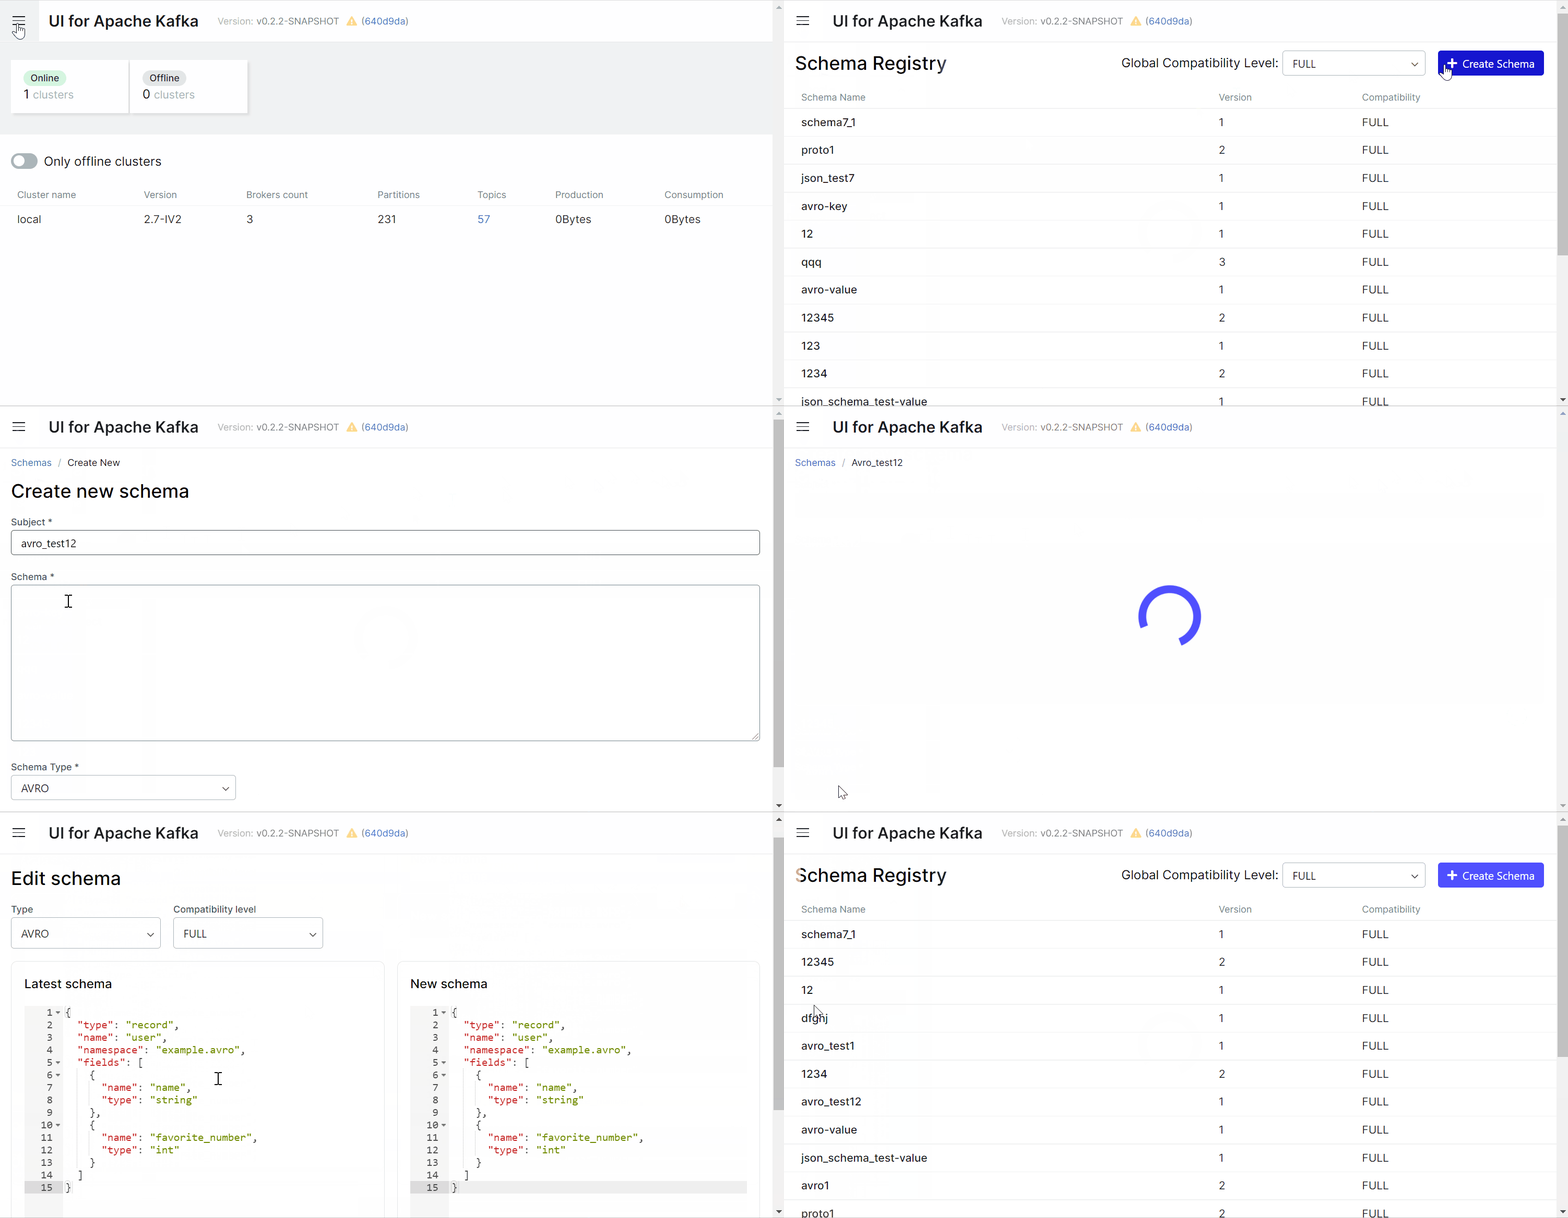
Before producing avro/protobuf encoded messages, you have to add a schema for the topic in Schema Registry. Now all these steps are easy to do with a few clicks in a user-friendly interface.
Getting Started
To run UI for Apache Kafka, you can use either a pre-built Docker image or build it (or a jar file) yourself.
Quick start (Demo run)
docker run -it -p 8080:8080 -e DYNAMIC_CONFIG_ENABLED=true provectuslabs/kafka-ui
Then access the web UI at http://localhost:8080
The command is sufficient to try things out. When you're done trying things out, you can proceed with a persistent installation
Persistent installation
services:
  kafka-ui:
    container_name: kafka-ui
    image: provectuslabs/kafka-ui:latest
    ports:
      - 8080:8080
    environment:
      DYNAMIC_CONFIG_ENABLED: 'true'
    volumes:
      - ~/kui/config.yml:/etc/kafkaui/dynamic_config.yaml
Please refer to our configuration page to proceed with further app configuration.
Some useful configuration related links
Web UI Cluster Configuration Wizard
Configuration file explanation
Helm charts
Building from sources
Quick start with building
Liveliness and readiness probes
Liveliness and readiness endpoint is at /actuator/health.
Info endpoint (build info) is located at /actuator/info.
Configuration options
All of the environment variables/config properties could be found here.
Contributing
Please refer to contributing guide, we'll guide you from there.


