InfoTestProcess
Captures per-worker JVM metrics for every Gradle test fork in your build and publishes them as Build Scan® custom values, ready for inspection in the scan UI or aggregation in Develocity Analytics (DRV).
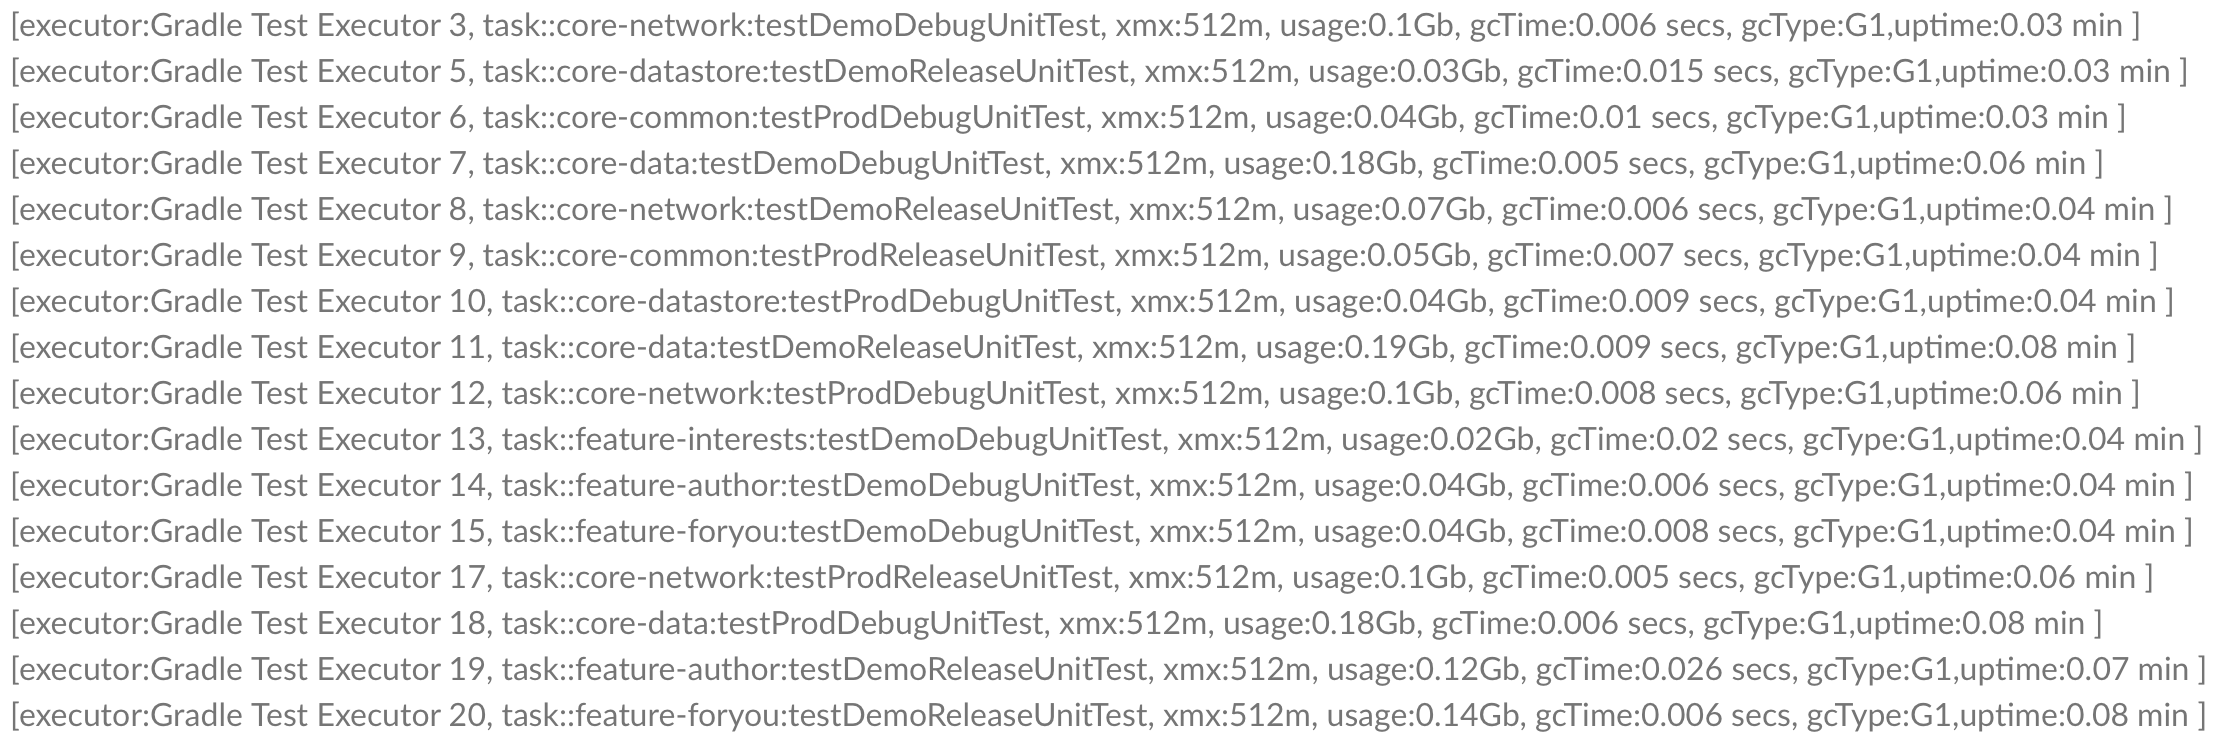
For each test worker JVM the plugin records:
- Identity — task path, executor name, configured
-Xmx, JVM args, start time, PID - CPU — total CPU time (
cpuTimeSec) and average cores busy (cpuCoresAvg) - Memory — heap usage at shutdown, peak heap across pools, peak metaspace
- GC — collector type (G1 / Parallel / Z / Shenandoah / CMS / Serial), collection count, total GC time
- JIT — total compilation time
- Class loading — total classes loaded
- Threads — peak thread count
[!NOTE] Since version 1.0.0 the plugin is applied in
settings.gradle(.kts).
Usage
Apply the plugin in your main settings.gradle(.kts):
plugins {
    id("io.github.cdsap.testprocess") version "2.1.0"
}
That's it. The plugin attaches to every Test task in the build and produces output
in two modes:
| Mode | Output |
|---|---|
| Develocity applied | Custom values + scan tags published to the Build Scan |
| No Develocity | Structured JSON file at ${rootDir}/statsTestTasks.json |
Output
Build Scan custom values
Summary scalars (indexable in DRV)
| Key | Description |
|---|---|
testProcess.workers.count |
Number of test worker JVMs registered |
testProcess.workers.tasksWith |
Number of distinct test tasks that ran |
testProcess.workers.snapshotsMissing |
Workers that didn't write a stats snapshot (health signal) |
testProcess.worker.shown |
Workers whose detail blob was emitted (== count unless truncated) |
testProcess.cpuCoresAvg.max |
Highest cpuTime / uptime across all workers (>1 = multi-core utilization) |
testProcess.cpuTimeSec.sum |
Total CPU time across all workers |
testProcess.heapPeakGb.max |
Highest per-worker peak heap usage |
testProcess.metaspacePeakMb.max |
Highest per-worker peak metaspace |
testProcess.jitSec.sum |
Total JIT compilation time across workers |
testProcess.jitSec.max |
Worst single-worker JIT time |
testProcess.classesLoaded.max |
Largest classloader footprint |
testProcess.gcCollections.sum |
Total GC collections across workers |
testProcess.uptimeMin.sum |
Total worker wall-clock time |
Per-worker detail
One custom value per worker, key = testProcess.worker.<pid>, value = JSON:
{
  "pid": 13402,
  "task": ":core:domain:testDemoDebugUnitTest",
  "executor": "Gradle Test Executor 5",
  "xmx": "512m",
  "uptimeMin": 0.02,
  "cpuTimeSec": 3.05,
  "cpuCoresAvg": 3.31,
  "heapUsageGb": 0.14,
  "heapPeakGb": 0.14,
  "metaspacePeakMb": 14.54,
  "gcType": "G1",
  "gcCollections": 2,
  "gcTimeSec": 0.0,
  "jitSec": 2.28,
  "classesLoaded": 3503,
  "peakThreads": 10,
  "statsSnapshotMissing": false
}
If a build exceeds Develocity's 1,000-unique-values-per-scan cap (i.e. >950 workers),
the heaviest workers by cpuTimeSec are kept and the plugin emits
testProcess.worker.truncated=true plus testProcess.worker.total=<count> so you
know data was dropped.
Scan tags
Categorical filters for fast slicing in DRV. Fired automatically when thresholds hit:
| Tag | When |
|---|---|
tests:cpu-heavy |
Any worker cpuCoresAvg > 4.0 |
tests:near-oom |
Any worker heapPeak / xmx ≥ 0.8 |
tests:jit-bound |
Any worker jitSec / cpuTimeSec ≥ 0.5 and jitSec ≥ 1.0 |
tests:no-snapshot |
One or more workers didn't write a stats snapshot |
File output (no Develocity)
Without Develocity, the same data is written to
${rootDir}/build/info-test-process/statsTestTasks.json as a single nested document
with summary / byTask / workers / tags (the file lives under build/ so
it's covered by every project's existing .gitignore and wiped by ./gradlew clean):
{
  "summary": {
    "workers": {
      "count": 1,
      "tasksWith": 1,
      "snapshotsMissing": 0
    },
    "cpuCoresAvgMax": 2.41,
    "cpuTimeSecSum": 0.42,
    "heapPeakGbMax": 0.02,
    "metaspacePeakMbMax": 7.2,
    "jitSecSum": 0.2,
    "jitSecMax": 0.2,
    "classesLoadedMax": 2711,
    "gcCollectionsSum": 0,
    "uptimeMinSum": 0.0
  },
  "byTask": {
    ":test": {
      "workers": 1,
      "cpuCoresAvgMax": 2.41,
      "cpuTimeSecSum": 0.42,
      "heapPeakGbMax": 0.02,
      "jitSecMax": 0.2,
      "classesLoadedMax": 2711,
      "peakThreadsMax": 9
    }
  },
  "workers": [
    {
      "pid": 20910,
      "task": ":test",
      "executor": "Gradle Test Executor 24",
      "xmx": "512m",
      "uptimeMin": 0.0,
      "cpuTimeSec": 0.42,
      "cpuCoresAvg": 2.41,
      "heapUsageGb": 0.02,
      "heapPeakGb": 0.02,
      "metaspacePeakMb": 7.2,
      "gcType": "G1",
      "gcCollections": 0,
      "gcTimeSec": 0.0,
      "jitSec": 0.2,
      "classesLoaded": 2711,
      "peakThreads": 9,
      "statsSnapshotMissing": false
    }
  ],
  "tags": []
}
byTask is intentionally not emitted on the scan — it's derivable from the per-PID
values via DRV (see below) and would duplicate data against the per-scan value cap.
It is included in the file output because the file isn't subject to scan limits and
the precomputed summary aids local inspection.
Querying from Develocity Analytics (DRV)
Find builds with heavy workers
SELECT build_id
FROM gradle_attributes_custom_values
WHERE name = 'testProcess.cpuCoresAvg.max'
  AND CAST(value AS DECIMAL) > 4;
Reconstruct per-task aggregates on the fly
SELECT
  JSON_VALUE(value, '$.task')                  AS task,
  COUNT(*)                                     AS workers,
  MAX(JSON_VALUE(value, '$.cpuCoresAvg'))      AS cpu_cores_max,
  SUM(JSON_VALUE(value, '$.cpuTimeSec'))       AS cpu_time_sum,
  MAX(JSON_VALUE(value, '$.heapPeakGb'))       AS heap_peak_max,
  MAX(JSON_VALUE(value, '$.jitSec'))           AS jit_max
FROM gradle_attributes_custom_values
WHERE build_id = '<scan-id>'
  AND name LIKE 'testProcess.worker.%'
  AND name NOT IN (
    'testProcess.worker.shown',
    'testProcess.worker.truncated',
    'testProcess.worker.total'
  )
GROUP BY task;
Filter to "cpu-heavy or jit-bound" builds
SELECT build_id FROM builds WHERE tags && ARRAY['tests:cpu-heavy', 'tests:jit-bound'];
How it works
The plugin uses a small Java agent (~5 KB, no runtime dependencies) that is injected
into every Gradle test worker JVM via -javaagent:. The agent:
- On JVM startup (
premain), reads a sentinel system property to learn its task path and writes a JSON identity file to a known directory. - On JVM shutdown, reads
RuntimeMXBean/MemoryMXBean/GarbageCollectorMXBean/OperatingSystemMXBean/CompilationMXBean/ClassLoadingMXBean/ThreadMXBeanand writes a stats snapshot to the same directory.
At the end of the build, the plugin reads those files, joins identity with stats by PID, and publishes the data. This avoids:
- The race conditions of polling
ProcessHandle.descendants()from the daemon - External
jstatshell-outs (and thebash/Windows portability headaches) - Misattribution from parsing JVM
tmpdirpaths to guess task identity
The agent itself runs in the worker JVM and has no Kotlin / kotlinx dependency — it adds nothing to the worker's bootclasspath beyond a single ~5 KB class file.
Configuration cache compatibility
| Mode | Status |
|---|---|
--configuration-cache (basic) |
✅ Stored on first build, reused on subsequent builds |
--configuration-cache-problems=fail (strict) |
✅ No problems reported |
-Dorg.gradle.unsafe.isolated-projects=true (Isolated Projects) |
✅ |
| Gradle 8.x, 9.x | ✅ Both verified in the integration test suite |
The plugin does no filesystem I/O at apply time — agent jar extraction and registry
directory setup are deferred to a BuildService init block, which runs at task
execution time (after CC restoration).
Requirements
- Gradle 8 or later
- Test workers running JDK 17 or later (the bundled Java agent is compiled to Java 17 bytecode)
- Optional: Develocity, if you want the data on Build Scans