SpockAdb
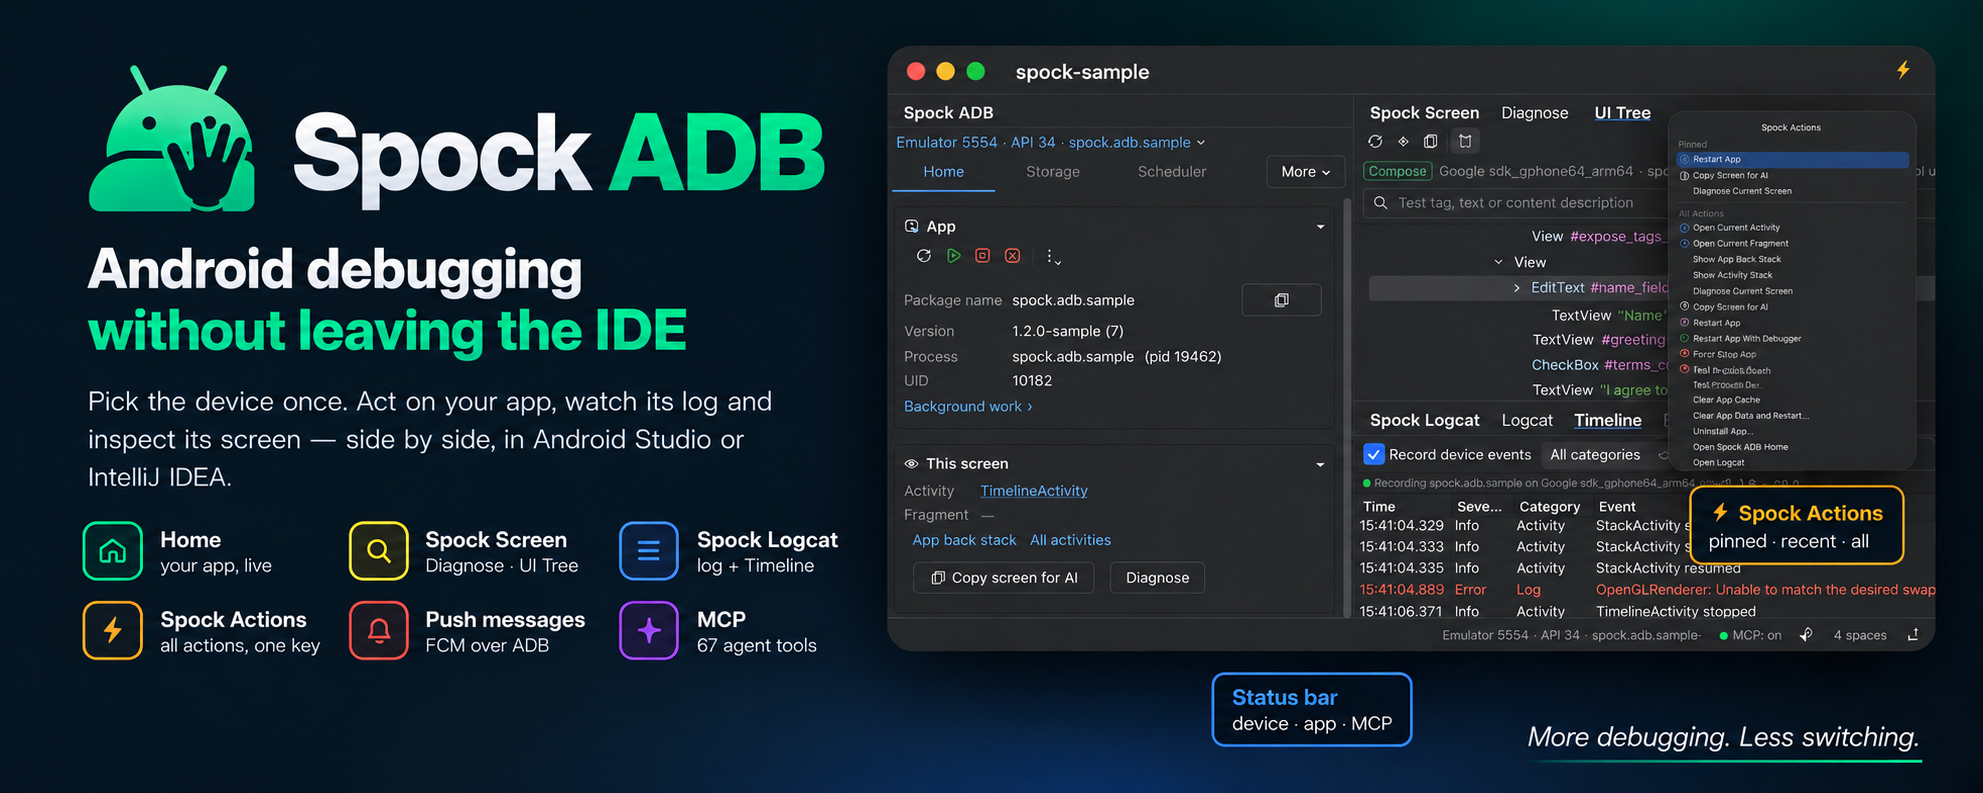



Android debugging without leaving the IDE
Inspect, control, and debug your Android app and device directly from Android Studio or IntelliJ IDEA — without constantly switching to the terminal, Device Manager, Settings, or external tools.
Spock ADB brings ADB workflows into the IDE and keeps one selected device and app as the active target across Home, Storage, Work, Shell, Logcat, the Debug Timeline, Diagnose and the UI Inspector — plus a built-in MCP server exposing 71 strongly typed tools for Android and Flutter apps to Claude Code, Claude Desktop, Cursor, and other AI clients.
One IDE · One device target · Fewer ADB commands
Install from JetBrains Marketplace · View Documentation
Contents
- Stop jumping between tools
- Everything you need for Android debugging
- Why use Spock ADB?
- Built for real debugging workflows
- Get started
- Documentation
- License
Stop jumping between tools
A normal Android debugging session can quickly become:
Android Studio → Terminal → adb → Logcat → Device Settings → back to Android Studio
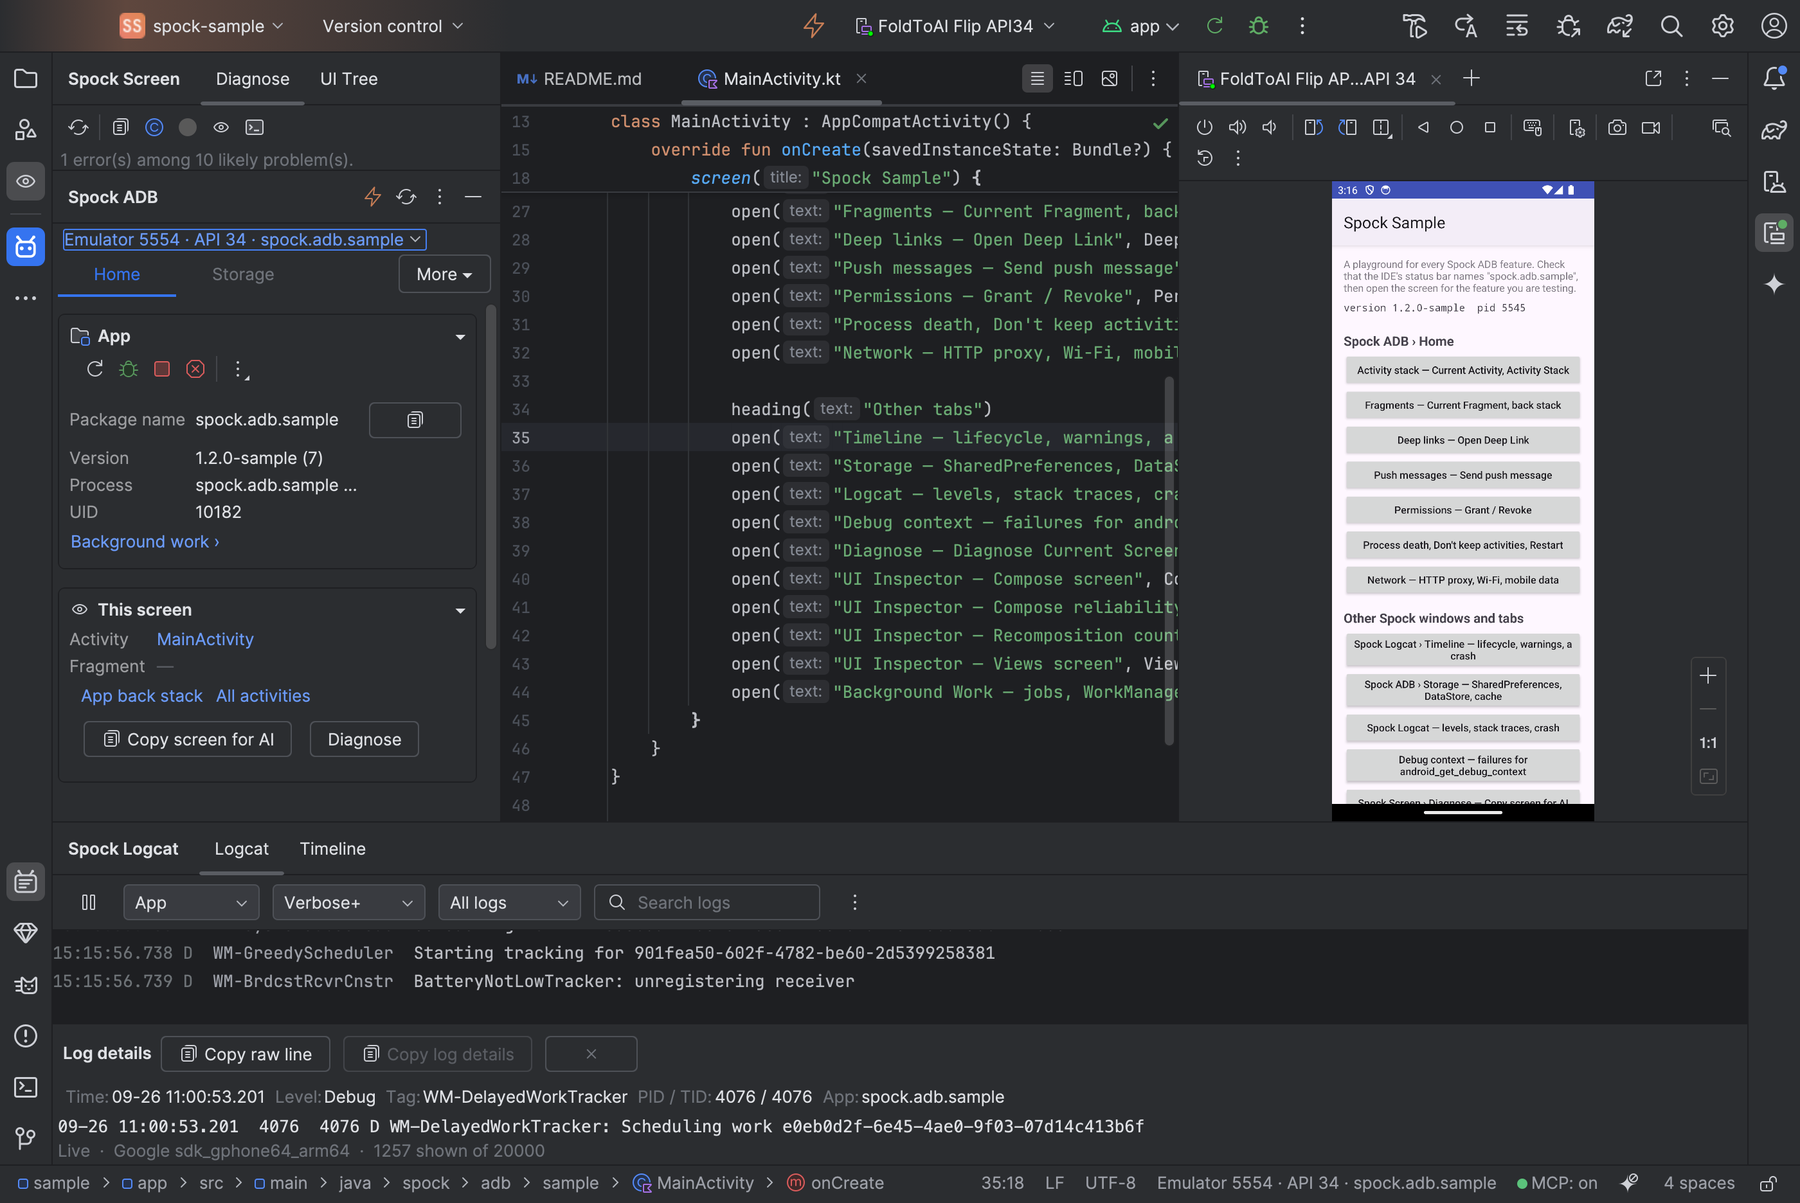
Spock ADB brings those workflows into the IDE and keeps one selected device + app as the target of everything it does. It is laid out by what each part is for:
- Status bar — the device and app every Spock surface acts on (it follows Android Studio's run target by default), and whether the MCP server is on.
- Spock ADB (left) — Home (the app, the screen it is on, its permissions, device controls), Storage, Scheduler and Shell.
- Spock Logcat (bottom) — the app's log and the Debug Timeline, beside the actions that produce them.
- Spock Screen (left, above Spock ADB) — Diagnose and the UI Tree of the screen in front of you.
- ⚡ Spock Actions (main toolbar) — every action, searchable, with pins and recents; bind it to a shortcut in the keymap.
| Task | Without Spock ADB | With Spock ADB |
|---|---|---|
| Find current Activity | adb shell dumpsys... + search output |
Open Current Activity |
| Find current Fragment | dumpsys / debug code / manual inspection | Open Current Fragment |
| Restart / force stop | Terminal ADB commands | One action |
| Test process death | Manual ADB commands | One action |
| Manage permissions | pm grant / pm revoke |
Visual permission controls |
| Inspect SharedPreferences | run-as + shell + file editing |
Browse & edit directly |
| Inspect DataStore | Pull/read files manually | Built-in typed editor |
| App-only Logcat | Find PID + build filters | App scope automatically |
| Investigate crashes / ANRs | grep/filter Logcat manually | Built-in filters |
| Inspect background work | Read large dumpsys job/alarm output |
Jobs and alarms in tables |
| Inspect UI hierarchy | uiautomator dump + XML inspection |
Visual UI Inspector |
| Check accessibility | Manual inspection | Built-in accessibility checks |
| Send a deep link | adb shell am start ... |
Open Deep Link |
| Send a test push message | web console, token, payload form | Push message → Compose… |
| Change HTTP proxy | settings put/get ... |
Proxy controls + verification |
| Run ADB commands | Leave the IDE for Terminal | ADB Command Center |
| Give AI access to Android | Custom scripts / shell access | Structured MCP tools |
The result
Workflows that normally require several commands, copy/paste operations, PID lookups, and context switches become one or two actions without leaving your editor.
Everything you need for Android debugging
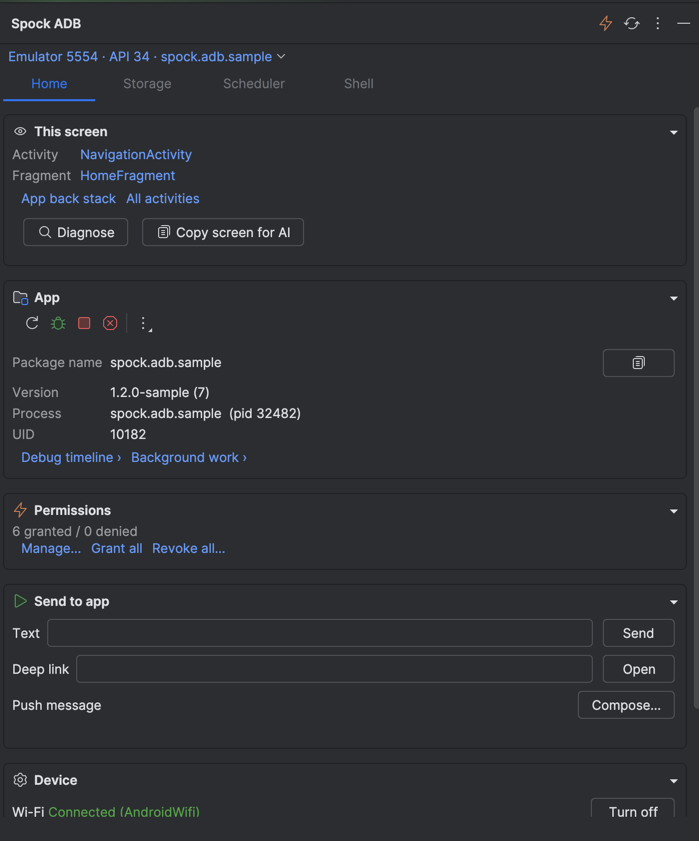
🏠 Home: the app, its screen and the device
The first tab of the Spock ADB window answers the questions you would otherwise run a command for, and puts the actions you use most in one row.
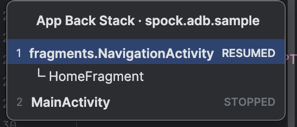
- This screen — the resumed activity and the app's fragments, read live, as links to their source; Diagnose, and Copy screen for AI, which diagnoses and copies the redacted report in one click. App back stack lists the app's activities top first, each with its state and the fragments it holds; All activities shows every task on the device.
- App — version, process and UID, with Restart, Attach debugger, Force stop and Process death in a toolbar. Clear cache, Clear data and Uninstall sit behind ⋯, never one click from Restart. Links jump to the Debug timeline and Background work.
- Permissions — how many are granted and which won't be asked again, with Manage…, Grant all and Revoke all….
- Send to app — text input, deep links and push messages.
- Device — Wi-Fi and mobile data, HTTP proxy, and developer options (Don't keep activities, Show taps, layout bounds, animation scales), which start hidden on a fresh install. Folded until you need it.
The device and app it acts on are the ones in the status bar: they follow Android Studio's run target by default, and a click changes them for every Spock window at once.
🔔 Push messages
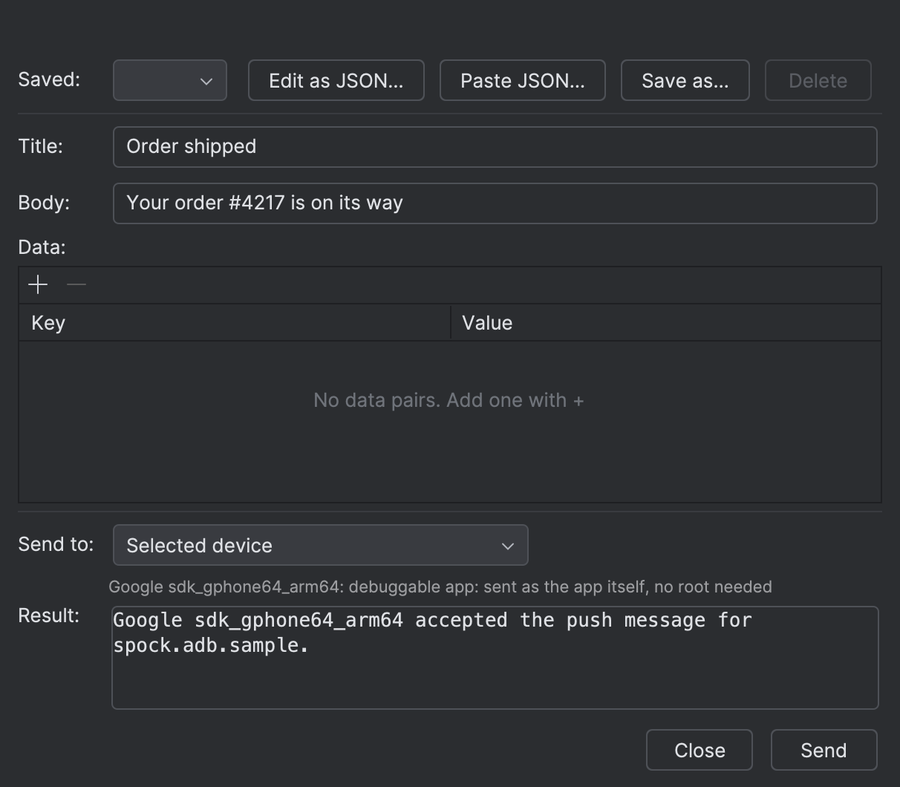
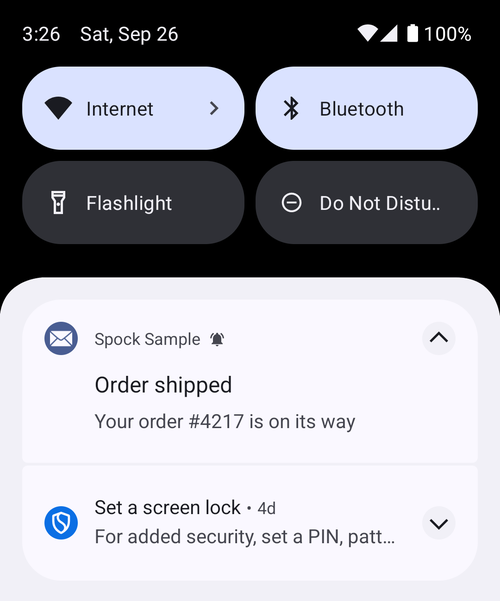
Home › Device › Push message → Compose… sends a test FCM message straight to the app's messaging receiver over ADB — no web console, no registration token. Add data pairs, or a title and body for a notification message; paste an FCM request or edit it as JSON; save payloads per project; send to one device or all of them. The result says, per device, whether the message was accepted or refused.
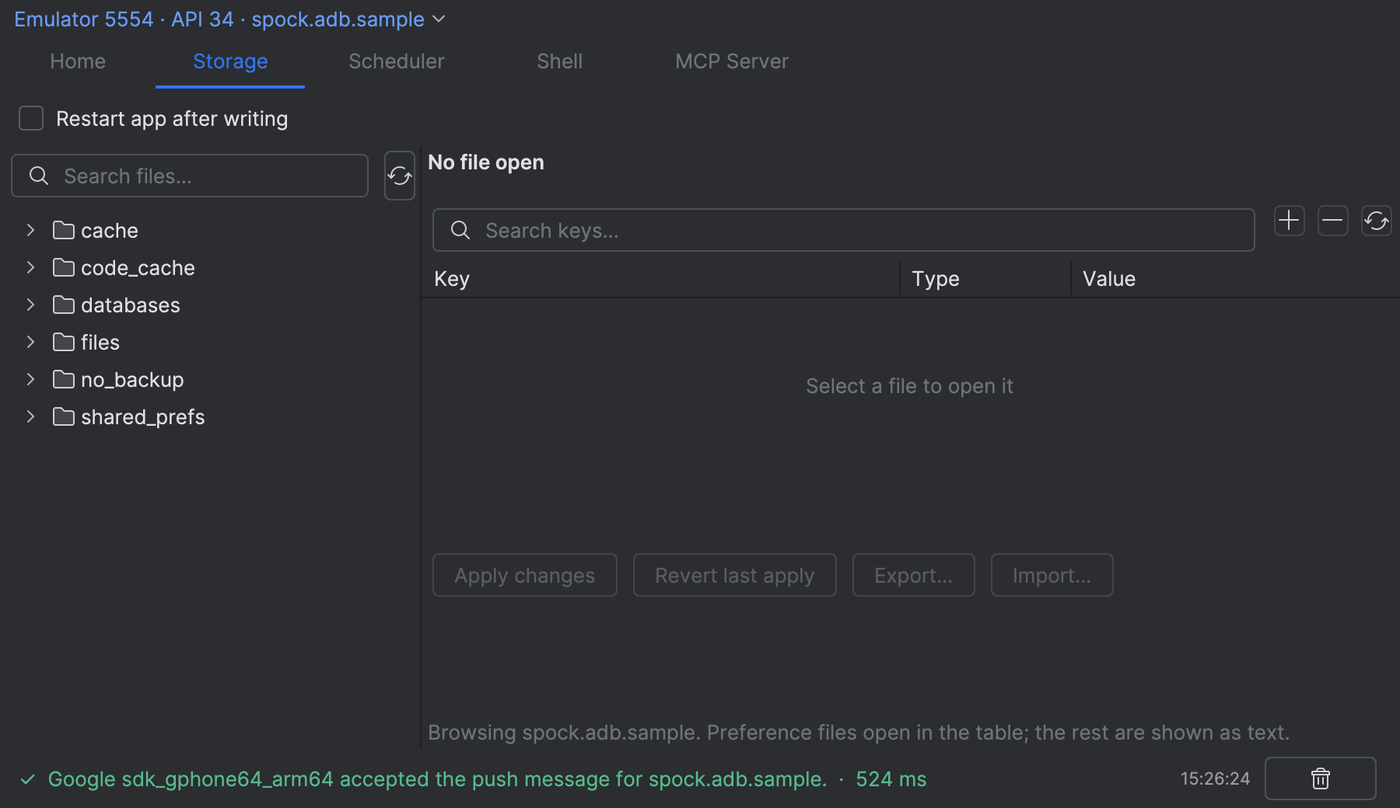
🗂 App Storage
Inspect your app's private storage directly from the IDE.
Browse:
shared_prefs/ · files/ · databases/ · cache/ · DataStore
Edit supported SharedPreferences and Preferences DataStore values using typed fields instead of manipulating files through adb shell run-as.
Changes are checked, written, and read back instead of assuming the command worked.
📜 Logcat, without the noise
Spock Logcat docks at the bottom of the IDE, beside the actions that produce the log, and starts with the selected app, not the entire device.
Choose the scope you actually need:
App — only your application's processes Related — your app + relevant Android system components All — the full device log
Then narrow it further with:
Errors · Crashes · ANRs · Network · Search · Regex
No manual PID lookup.
No giant adb logcat | grep ... commands.

⌨️ Shell
Still need the shell? The Shell tab of the Spock ADB window is an ADB command center.
Run ADB commands inside the IDE with:
Autocomplete with docs · Device targeting · History · Favourites · Timeout · Cancellation · Searchable output · Execution status
Start typing and Spock suggests what comes next — commands, subcommands, flags, key codes and
the device's installed packages — with the usage and a one-line explanation of each one, so you
no longer have to remember whether it was pm clear or am clear. ↑/↓ to choose, Tab
to insert, Ctrl+Space or Alt/Option+Space to ask, Esc to close. Enter inserts a
suggestion you picked with the arrows, or the best match of a word you are still typing; once a
word is typed in full, Enter runs the command.
You keep the power of ADB without constantly opening another terminal.

🩺 Diagnose Current Screen
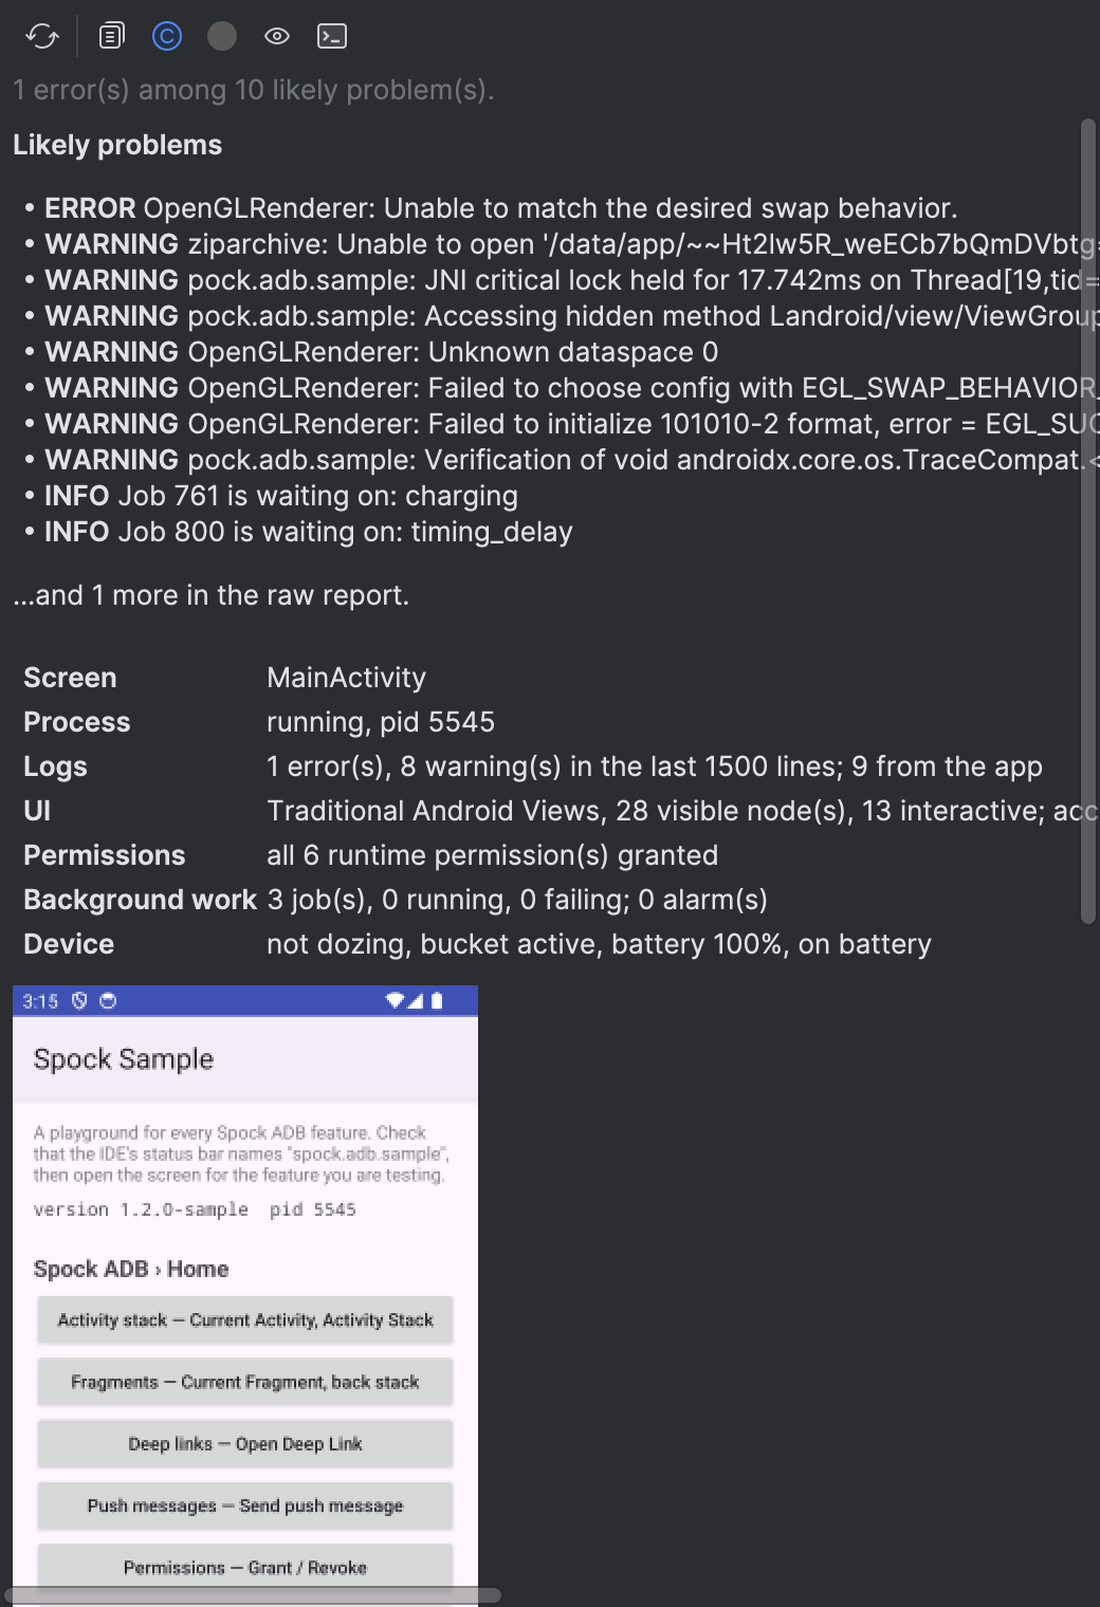
Spock Screen › Diagnose — or Diagnose and Copy screen for AI on Home — reads everything about the screen in front of you, for the selected device and app:
Current activity, activity stack and fragments · Screenshot · Likely problems from Logcat · UI and accessibility summary · Process state · Runtime permissions · Jobs and alarms · Doze, standby bucket, battery and charger
Problems come first, ranked; a part that cannot be read is reported in place and never costs you the rest. From the summary go straight to Open Activity, Open Fragment, Inspect UI or View Related Logs, or Copy for AI. Agents get the same report from android_diagnose_current_screen.
🕒 Debug Timeline
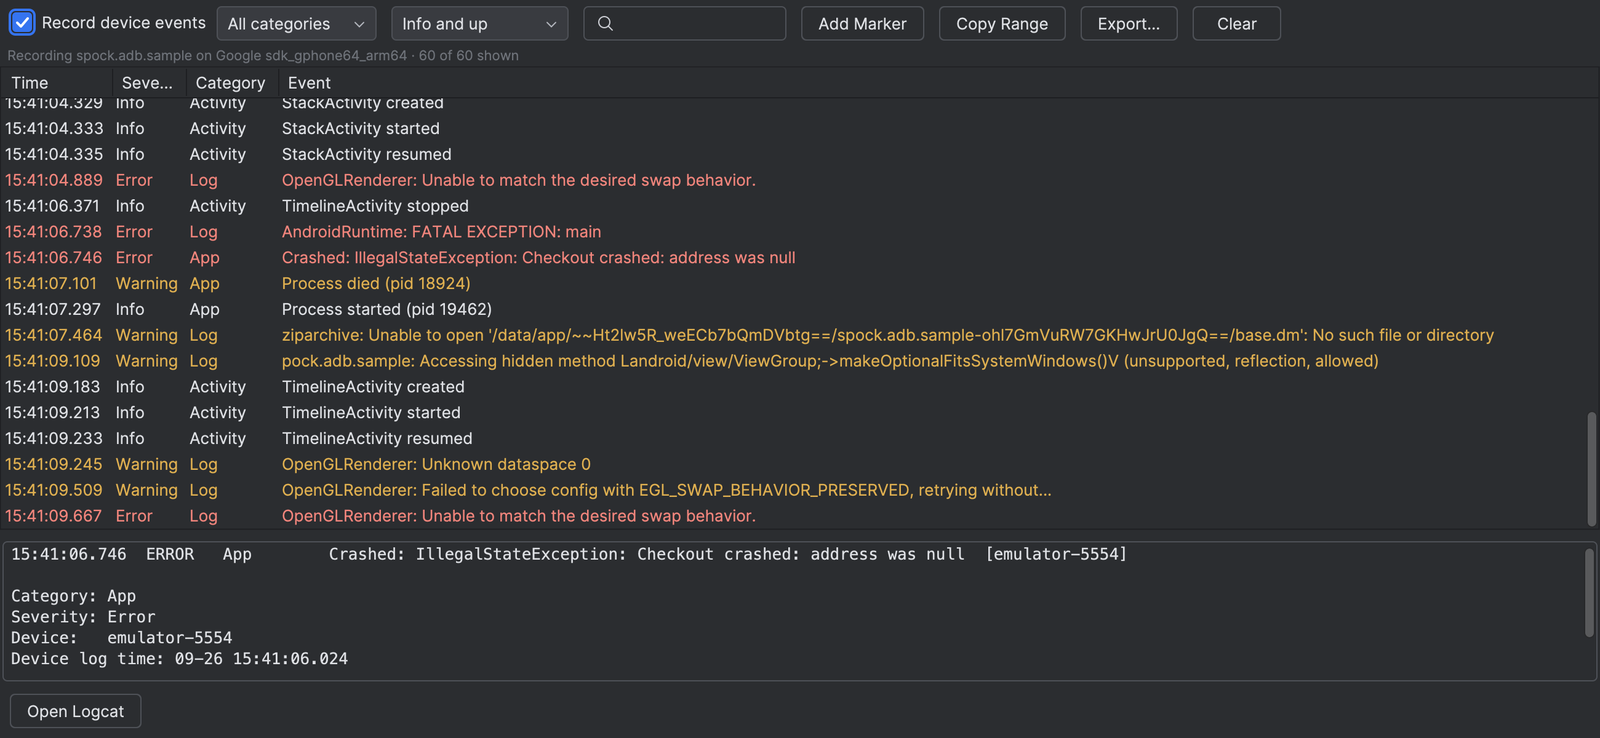
Spock Logcat › Timeline — what happened just before the bug, in one list and on one clock:
Activity lifecycle and fragments · Process starts, deaths, crashes and ANRs · The app's warnings and errors · Actions run from Spock · Storage writes, jobs run and device-condition changes · Devices connecting · Agent tool calls · Your own markers
Filter by category and severity, select an event for its detail and the tab it came from, and select two events to Copy Range or Export everything between them into a bug report. Device log times are moved onto the host's clock with a measured offset, so an action and the log line it caused appear in the order they happened. The history is bounded and says when the oldest events were dropped. Agents read the same list with android_get_debug_timeline.
🔍 UI Tree
Spock Screen › UI Tree inspects the UI currently running on the device.
Supports:
Android Views · Jetpack Compose · Hybrid screens
Inspect text, content descriptions, bounds, test tags, interaction state, and other semantics — with sizes in dp, whether each element is actually in view, and which device, window and moment the capture came from.
Select an element to copy a selector for it — MCP arguments, a Compose test finder, or a UI Automator selector — checked against the captured screen, so one that would match several elements says so before you paste it.
Jump to Source opens the code that drew the selected element, found in the open project by its test tag, resource id, text, or View class.
Recompositions records a Compose app for a few seconds and lists how many times each composable composed or recomposed, with its source line, from Compose's own composition tracing. The app needs androidx.compose.runtime:runtime-tracing and androidx.tracing:tracing-perfetto-binary in its debug build.
Spock ADB can also detect common accessibility problems such as:
Missing labels · Duplicate labels · Touch targets below 48dp

⏱ Scheduler
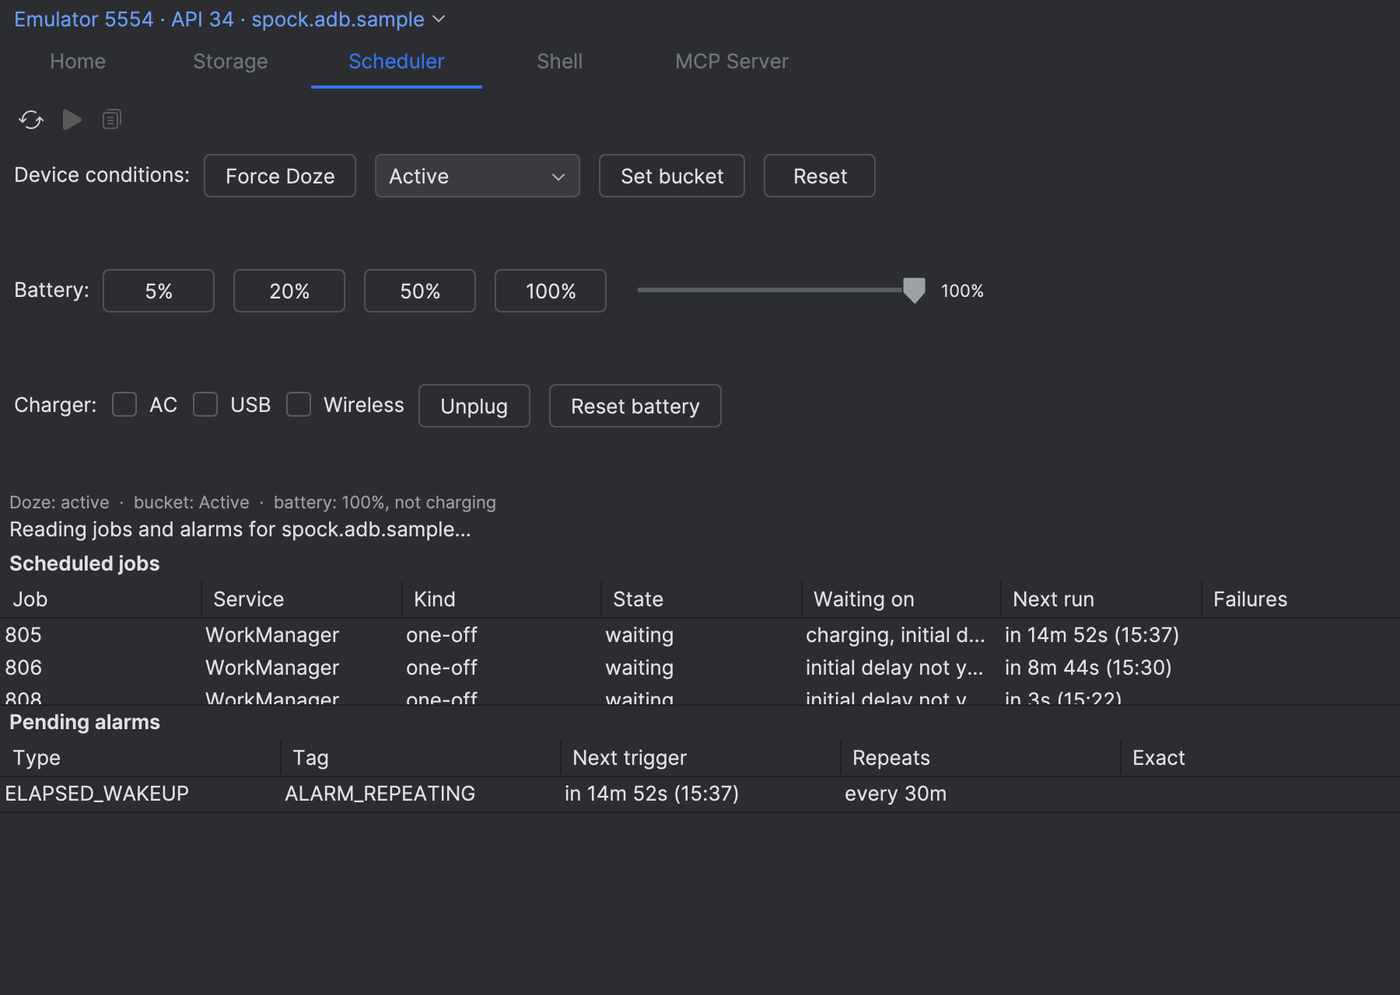
The Scheduler tab shows what's actually scheduled to run on the device.
Inspect:
Scheduled jobs (JobScheduler & WorkManager) · Pending alarms
Run a supported job on demand instead of waiting for the system to trigger it, and inspect — with a reset — the device conditions that gate background work:
Doze · App Standby buckets · Battery level (presets or slider) · Per-charger AC/USB/wireless toggles
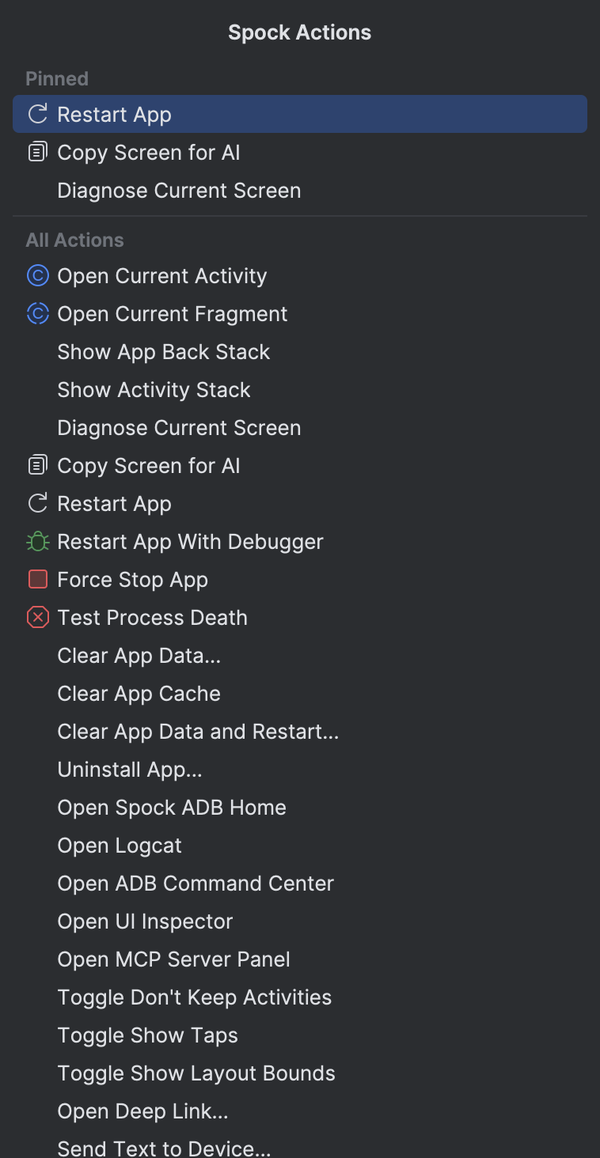
⚡ Spock Actions
Every Spock ADB action in one searchable popup, from the main toolbar or a shortcut you bind in the keymap: your pinned actions first, then the last five you used, then all of them — restart, clear data, process death, the developer-option toggles, open a deep link, send text, copy the screen for AI. They act on the device and app in the status bar, with every tool window closed.
🐦 Flutter apps
Spock covers the device half of a Flutter app on Android, beside the Flutter plugin and the Dart MCP server, which cover the widgets. Home shows Flutter debug, profile or release; Storage reads flutter. preferences with their real types, Hive boxes and SQLite databases; Logcat has a Flutter view. Run the app with flutter run and Spock connects to it by itself — nothing to paste — so Diagnose lists Flutter's own errors beside the logcat lines and native crashes around them, the Timeline records errors, routes and failed requests, and Home shows the current Flutter route. Agents check the connection with flutter_app_status.
See Flutter apps for what works in which build, the limits, and how to run Spock's MCP server next to Dart's.
🤖 Android debugging for AI agents
Spock ADB includes a built-in MCP server for tools such as Claude Code, Claude Desktop, Cursor, and other MCP clients.
Instead of giving an AI agent unrestricted shell access, Spock ADB exposes 71 structured debugging tools for Android and Flutter apps.
Agents can inspect things such as:
Activity · Fragment · UI tree · Logcat · Screenshots · Storage · Background work · Device state
and perform actions such as:
Launch · Tap · Input text · Deep links · App lifecycle operations
Element actions refuse to guess between look-alike targets, can wait for the screen to change instead of sleeping, and can check that a tap had the effect it should — without ever sending it twice.
Sensitive or destructive operations can require approval, and MCP activity remains visible inside the IDE. The status bar shows the server's state — a green dot while it runs, amber when an agent is driving a different device from the one you selected — and a click starts or stops it, connects a client, or opens the agent activity.
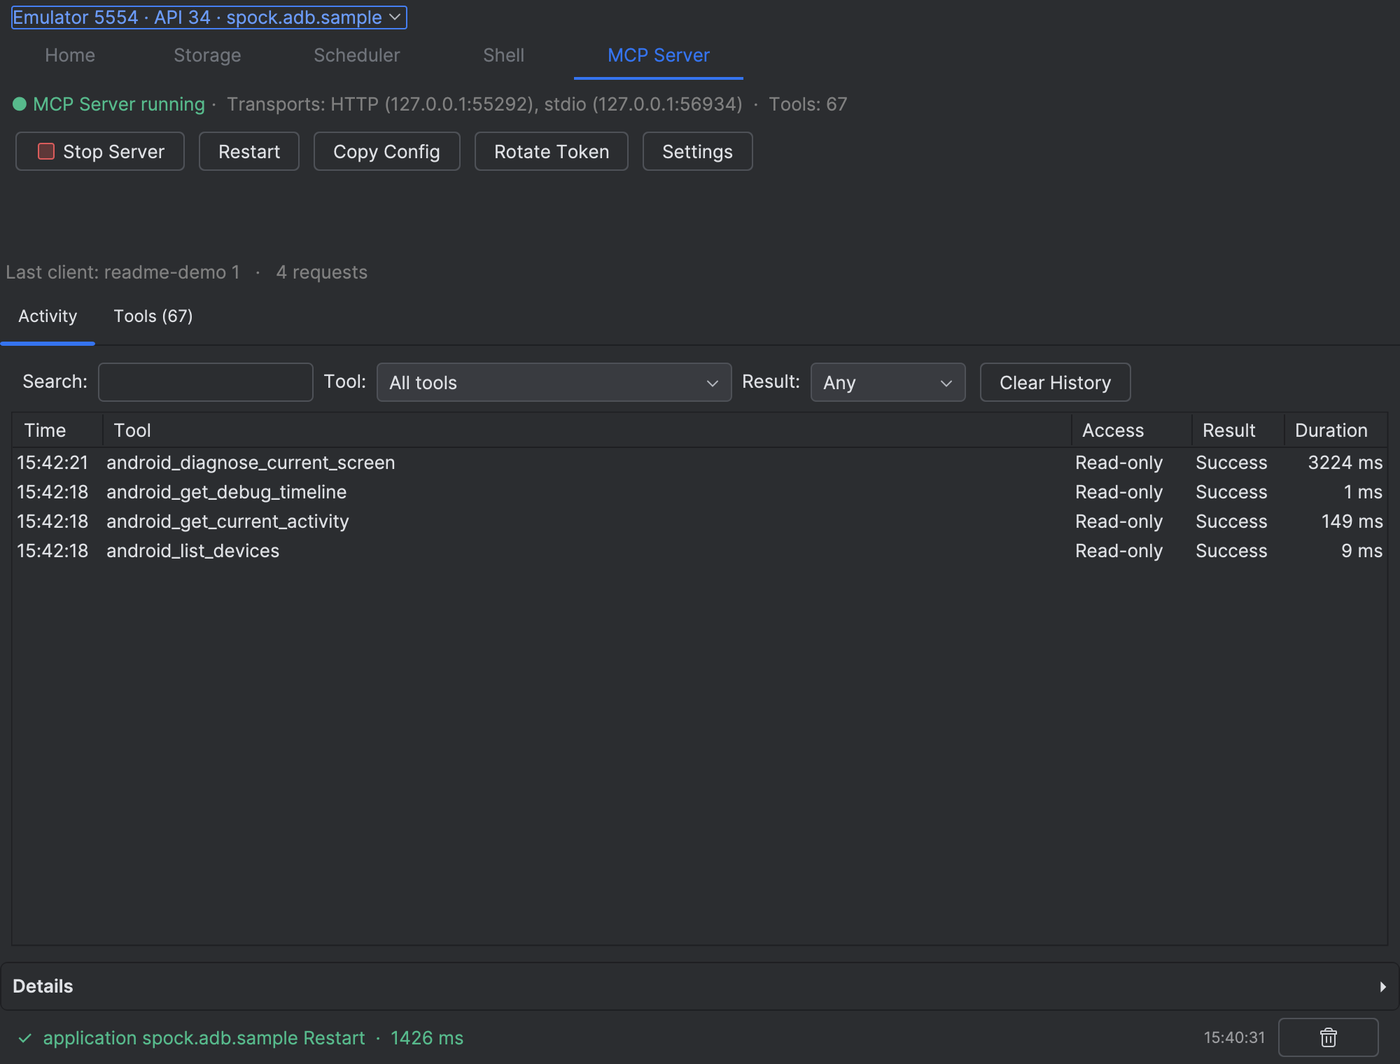
See MCP documentation for setup, the complete tool list, and safety details.
To teach an agent which tools to call and in what order, install the Spock ADB Agent Skill: debugging playbooks for UI bugs, state bugs, crashes and ANRs, process death, background work, deep links and accessibility.
Why use Spock ADB?
Without Spock
Android Studio ↓ Terminal ↓ Find the device ↓ Find the package ↓ Remember the ADB command ↓ Parse the output ↓ Switch back to the IDE
With Spock
Android Studio ↓ Select device + app ↓ Run the action
Built for real debugging workflows
Spock ADB isn't an ADB command cheat sheet.
It provides a shared debugging workspace where Home, Storage, Work, Shell, Logcat, Timeline, Diagnose, UI Inspector and MCP all use the same selected Android device and application.
That means less setup, fewer targeting mistakes, and less time spent fighting your tools.
Get started
- Install Spock ADB from the JetBrains Marketplace.
- Connect a device or start an emulator.
- Open the Spock ADB tool window.
- Check the device and app in the status bar — Spock ADB picks your project's app and follows Android Studio's device; click it to choose another.
- Debug.
No Android project handy?
./gradlew -p sample :app:installDebugbuilds the bundled sample app — every plugin feature has a labeled screen to try it against.
Spend less time operating ADB. Spend more time debugging your app.
Documentation
MCP setup & tools · Flutter apps · IDE compatibility · Release history · Contributing
License
Spock ADB is available under the Apache License 2.0.