BarChart-master
Introduction: 自动伸缩的 chart
Tags:
android-可动态改变的折线图-统计图-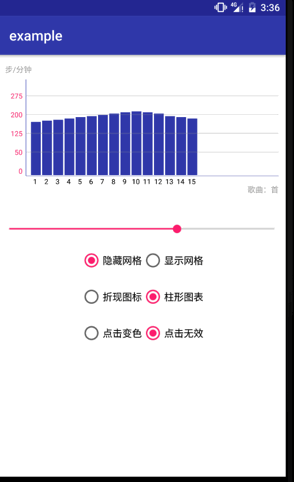
Usage
Please refer to the example. for seeing it in action.
Shortcut to attrs.xml.
XML
Add library dependency to your build.gradle file then copy this code to layout
  <com.example.library.BarChartView
            android:id="@+id/chart"
            android:layout_marginTop="25dp"
            android:layout_width="match_parent"
            android:layout_height="match_parent"
            app:axisColor="@color/colorPrimary"
            app:hideGirdLine="false"
            app:barColor="@color/colorPrimary"
            app:max="300"
            app:type="line"
            app:radius="15"
            app:yAxisTxtColor="@color/colorAccent" />
Attributes(布局中调用)
| Attributes | format | describe |
|---|---|---|
| axisColor | color | 设置 xy 轴颜色 |
| axisWidth | integer | 设置轴的宽度 |
| xAxisTxtColor | color | 设置 x 轴 label 的字体颜色 |
| yAxisTxtColor | color | 设置 y 轴 label 的字体颜色 |
| barColor | color | 设置 chart 的颜色 |
| hideGirdLine | color | 是否隐藏背景表格 |
| max | color | 设置 y 轴的最大值 |
| barPressEnable | color | 设置 chart 点击是否有反应(变色) |
| radius | color | 设置折线图圆形半径 |
| type | color | 设置 chart 样式 |
Method(代码中调用)
| methodName | describe |
|---|---|
| setHideGirdLine(boolean) | 设置隐藏背景表格 |
| setBarPressEnable(boolean) | 设置 chart 点击事件 |
| setBarChartList(float[]) | 设置数据 |
| setCharType(int) | 设置 chart 类型 |